Why a Local Debugging Tool is Non-Negotiable for Building AI Apps: Genkit Developer UI vs Vercel AI SDK DevTools vs Mastra Studio (English)
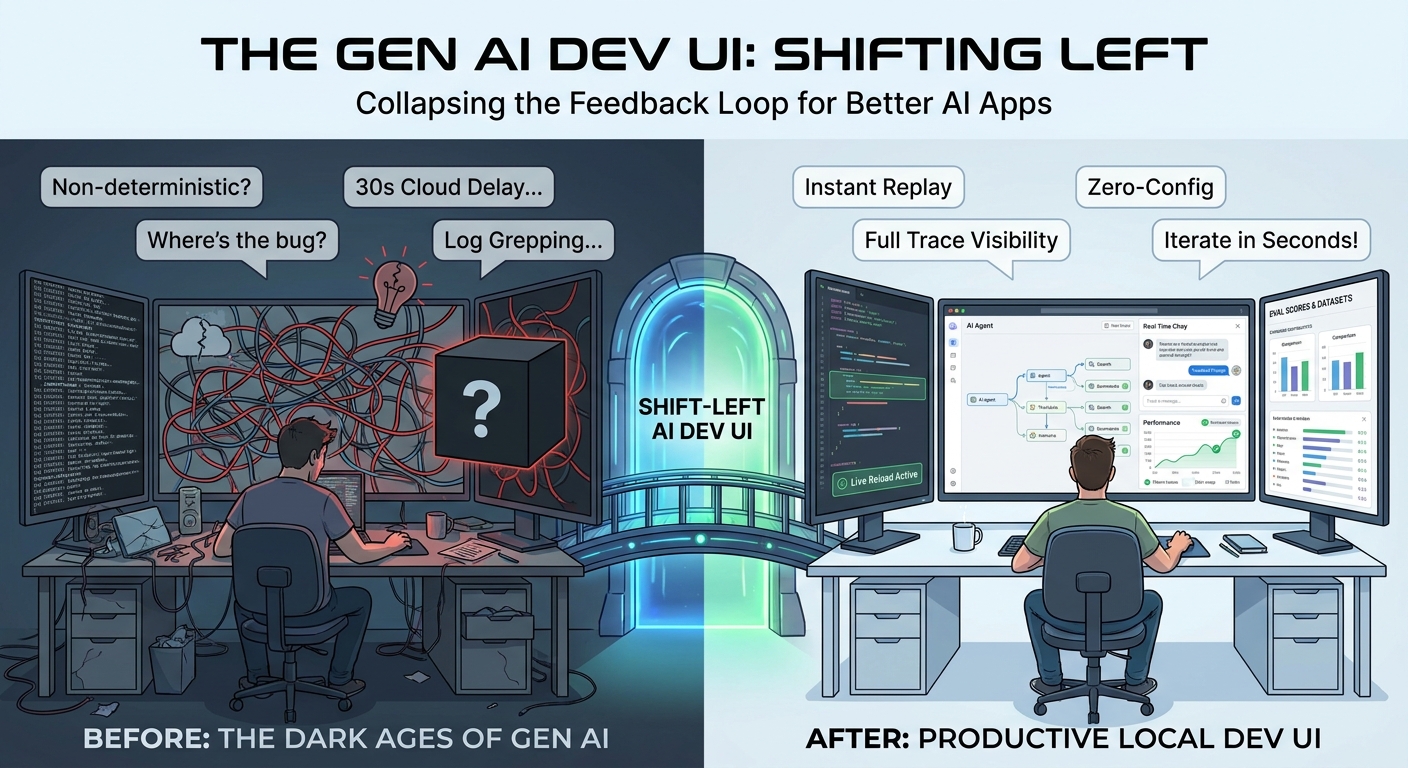
Building AI applications without a local debugging tool is like writing backend code without a debugger. A look at the “shift-left” philosophy applied to Gen AI development, and a hands-on comparison of Genkit Developer UI, Vercel AI SDK DevTools and Mastra Studio.
- Introduction
- Shift-left, applied to Gen AI
- Genkit Developer UI
- Vercel AI SDK DevTools
- Mastra Studio
- Side-by-side comparison
- When I would pick which
- The moral of the story: pick a debugging tool, any debugging tool
- Conclusion
Introduction
If you have ever shipped a backend service without a debugger, a hot-reload dev server or decent logs, you remember how painful it was. Now imagine doing it in a world where your “function” is a non-deterministic black box that can rewrite its own output every time you call it. Welcome to building Gen AI applications.
The single biggest productivity multiplier I have found in the last two years of shipping AI apps is a good local debugging tool. Not a hosted dashboard. Not a cloud trace viewer with a 30-second propagation delay. A local tool that runs next to your code, picks up your edits, lets you replay a request with a tweaked prompt, and shows the full trace, tool call by tool call. We will get into the local-vs-hosted trade-off later in the article.
This article is about why that matters and how the three leading JS/TS Gen AI frameworks approach it:
They are three very different products solving overlapping problems, and each one makes different trade-offs that are worth understanding before you commit to one.
Shift-left, applied to Gen AI
“Shift-left” comes from the world of testing and security: the earlier in the development lifecycle you catch a problem, the cheaper it is to fix. Bugs found in production cost orders of magnitude more than bugs found while you’re typing.
Gen AI apps make this principle existential, not just economical, because the failure modes are weirder:
- A prompt regression doesn’t show up as a stack trace. It shows up as the wrong tone, a hallucinated fact or a tool call that misfires once every twenty runs.
- A new model version can quietly change behavior across thousands of code paths with no warning.
- A tool that returns slightly different JSON can cause silent downstream breakage.
The only way to keep your sanity is to collapse the feedback loop to seconds. You want to be able to:
- Change a prompt or a piece of orchestration code.
- Re-run that exact unit, with that exact input.
- See the model’s input, its output, every tool call, every retry, every token used.
- Compare it to the previous run.
- Decide if it’s better, worse or different.
If any one of those steps requires deploying, redeploying, opening a cloud console or grep’ing logs, you have already lost. Cycle time is the metric. A debugging tool is what makes that cycle time low enough to iterate productively.
Local vs hosted
It is worth being explicit about this trade-off, because all three tools in this article are primarily local:
- A local debugging tool runs on your machine, next to your code, with zero network latency between your edits and what you see. Iteration is fast, traces are immediate, and there is no risk of leaking prompts/responses to a third party. The downside is that it’s just for you.
- A hosted observability platform (Langfuse, LangSmith, cloud-native APM tools, etc.) is shared by your team, persists data long-term and is essential for production monitoring. The trade-off is propagation delay, configuration overhead and, in some cases, data residency concerns.
These are complementary, not competing. The argument here is that the local part of the loop is the one that’s still often missing, and that’s where shift-left lives.
What “good” looks like
After working with all three of the tools below, I would summarize the qualities of a good Gen AI debugging tool as:
- Zero-config or near-zero-config — it should pick up your code, not the other way around.
- Live reload — edit your code, save, hit “run” again. No restart.
- Interactive runners — invoke any prompt, tool, model, or higher-level primitive (agent, workflow, etc.) directly with arbitrary input.
- Full traces — every step of the generation loop, with input/output/usage at each node.
- Replay and modify — re-run any past trace with a tweak.
- Minimal code changes — the framework should be observable by default, ideally without you having to remember to wrap each model call.
Let’s see how each tool stacks up.
Genkit Developer UI
The Genkit team treats the Developer UI as a first-class part of the framework. It ships with the genkit-cli package and requires no code changes in your application to attach to your running process.
You install the CLI once globally:
npm install -g genkit-cli
And then start your app under it:
genkit start -- npx tsx --watch src/index.ts
That’s it. Genkit attaches to your running Node process, discovers every flow, prompt, model, tool, retriever, indexer, embedder and evaluator you have defined, and exposes them all in a local web app at http://localhost:4000.
Telemetry API running on http://localhost:4033
Genkit Developer UI: http://localhost:4000
What you actually get inside:
- Interactive runners for every primitive. Flows, prompts, tools, models, retrievers, indexers, embedders and evaluators all get an interactive panel where you fill out the input (validated against the Zod schema) and hit run.
- Full traces with the entire generation graph: every model call, every tool invocation, every middleware, with input/output/usage tokens.
- Live reload. Combined with
--watch, edits to your code show up without restarting the UI. - Prompt iteration. Tweak prompts and re-run inline.
- Evals. Run evaluators against datasets directly from the UI.
- Open by default. Add
-oto auto-open in your browser.
What stands out here is that observability comes for free. You do not wrap your model and you do not add a middleware just to see traces. Anything defined with the Genkit primitives is automatically introspected and traced, which makes the “let me see what’s happening” cost essentially zero.
If you also use the middleware system, every middleware also shows up in the trace, which makes debugging things like retries and fallbacks a lot easier.
Vercel AI SDK DevTools
Vercel introduced the AI SDK DevTools more recently, and it is a meaningful step up from having nothing. The design philosophy is different from Genkit’s: it is a middleware-based capture tool that focuses tightly on the language-model layer, rather than an integrated development environment for the whole AI app.
You opt in by wrapping your model:
import { wrapLanguageModel, gateway } from 'ai';
import { devToolsMiddleware } from '@ai-sdk/devtools';

const model = wrapLanguageModel({
  model: gateway('anthropic/claude-sonnet-4.5'),
  middleware: devToolsMiddleware(),
});
And then run the viewer in another terminal:
npx @ai-sdk/devtools
# open http://localhost:4983
What it captures:
- Input parameters and prompts.
- Output content and tool calls.
- Token usage and timing.
- Raw provider request/response payloads.
- Multi-step interactions are grouped into “runs” with multiple “steps”.
Things to keep in mind when comparing it with the others:
- It is opt-in per model. Every model you want to observe has to be wrapped explicitly. In a real codebase with many models, this usually means a shared factory or repeated wrapping. If you forget on one path, you have a blind spot.
- It focuses on the language-model layer. Anything happening above that layer (your own application logic, custom orchestration, business steps) is not captured unless you add it yourself.
- It is a viewer, not an interactive playground. You cannot “re-run this with a different prompt” from the UI; you go back to your code, edit and re-call.
- It does not enumerate AI primitives because, in the AI SDK, those are just functions in your codebase. There is nothing to enumerate at runtime.
- Storage is a JSON file (
.devtools/generations.json). The team is clear that this is local-only, never for production, and the middleware automatically appends.devtoolsto your.gitignore.
The upside is that it is probably the quickest of the three to drop into an existing project: install the package, wrap a model, run the viewer. If you live inside Next.js and the AI SDK and you mainly want a “what just happened?” panel for your model calls, it does the job well. If you are debugging a multi-step agent with custom orchestration, you will probably want to combine it with something that sees more of the picture.
Mastra Studio
Mastra Studio is the most ambitious of the three in terms of surface area. It is bundled with mastra dev and runs at http://localhost:4111, doubling as a local development tool and a deployable team console (you can ship Studio to production for non-developers).
Out of the box, it gives you:
- Agents tab — chat with your agents, hot-swap models, tweak temperature/top-p, view traces, attach scorers.
- Workflows tab — visualize workflows as graphs, run them step by step with custom inputs, watch the active step in real time, inspect tool calls and JSON outputs.
- Processors tab — see input/output processors and guardrails wired to each agent.
- Tools tab — run tools in isolation to debug them.
- Workspaces tab — file browser into the agent’s workspace filesystem, with a Skills tab listing discovered skills.
- MCP servers tab — list attached MCP servers and their tools.
- Request context — set runtime variables that flow into agent instructions/tools through DI, with schema-driven forms.
- Evaluation suite — Scorers, Datasets and Experiments tabs to run datasets through agents/workflows, attach scorers and compare experiments side-by-side.
- Observability with traces and logs.
- Editor integration for non-technical teammates to iterate on agents and version every change without redeploying.
This is more than a debugging tool — it is closer to a development environment plus a team-facing console. The natural trade-off is that Studio is tightly coupled to Mastra’s primitives (Agents, Workflows, Processors, Workspaces), so it shines the most when your application is structured the Mastra way.
If you build non-trivial agentic systems and you want evaluation and dataset management baked into the same tool, Studio is genuinely very good. For a quick “see my prompt and the model’s response” loop, it can feel like more than you need.
Side-by-side comparison
| Capability | Genkit Developer UI | Vercel AI SDK DevTools | Mastra Studio |
|---|---|---|---|
| Setup | genkit start -- your code | wrapLanguageModel(...) + npx @ai-sdk/devtools | mastra dev |
| Code changes required | None (auto-discovers) | Yes (wrap each model) | None (auto-discovers Mastra primitives) |
| Live reload | Yes (--watch) | N/A (viewer only) | Yes |
| Interactive runners | Flow, prompt, model, tool, retriever, indexer, embedder, evaluator | None (viewer only) | Agent chat, workflow runner, tool runner |
| Traces | Full generation graph | Per-model-call run/step | Workflow + agent traces |
| Re-run / replay | Yes, from any primitive | No (must edit code and re-call) | Yes, including workflow step-through |
| Dataset / eval UI | Evaluators panel | Not built-in | Datasets + Experiments + Scorers |
| Workspace / files browser | No | No | Yes |
| MCP server browser | Not first-class | No | Yes |
| Deployable to team | No (local-only) | No (local-only) | Yes (Studio on Mastra platform) |
| Languages | JS/TS (Go, Python, Dart all have local tooling too) | JS/TS only | JS/TS only |
| Style | Auto-discovery of primitives | Per-model middleware capture | All-in-one studio for the agent lifecycle |
A quick note on the Vercel column: simplicity of integration is a real feature for many teams, and it is fair to call this the lightest-touch option. The trade-off is that observability is opt-in per model, so you have to be deliberate to avoid blind spots.
When I would pick which
After using all three, this is roughly how I’d think about it:
- Building a serious agent or multi-step pipeline with tools, retries, fallbacks and evals → Genkit Developer UI is hard to beat on pure iteration speed. Zero-config tracing of the full pipeline, every primitive runnable, and middleware shows up in the trace for free.
- Working primarily inside Next.js with the Vercel AI SDK and you mainly want better visibility into model calls → Vercel AI SDK DevTools is a quick win. Lightweight setup and it does what it says on the tin; pair it with something else if you need higher-level orchestration views.
- Building agentic systems with workflows, datasets and scorers, and you want a UI your PM or domain expert can also use → Mastra Studio. The evaluation suite and the deployability are real differentiators.
- Multi-language stack (JS/TS plus Go, Python or Dart) → Genkit is the only one of the three with first-party multi-language support; the local tooling story is consistent across runtimes.
The moral of the story: pick a debugging tool, any debugging tool
In a normal backend project, you can sometimes get away with a weak dev loop because the code is deterministic. Bad UX, but it works.
In an AI project, the code is not deterministic. Every iteration is also a small experiment. If your loop is slow or your visibility is poor, you don’t just iterate slower, you iterate worse, because you can’t tell whether your changes are improvements or regressions. Shift-left in this world is not a virtue, it is a survival strategy.
A good local debugging tool:
- Turns “I think the prompt got better” into “I can see the trace, the tokens, the eval score, side by side”.
- Catches regressions before they reach a user.
- Lets you onboard new engineers in hours instead of days, because they can see the system.
- Lets non-engineers (PMs, designers, domain experts) participate in iteration when the UI is friendly enough — Mastra Studio is explicit about this.
If you are starting a Gen AI project today and you are picking a framework, the local tooling story should weigh as much as the model abstraction or the tool API. It is the difference between writing AI code and engineering AI features.
Conclusion
All three tools are good in their lane:
- Genkit Developer UI is the most introspective of the three and requires zero code changes to be useful. It’s the one I reach for when I want to move fast and see every step of the pipeline.
- Vercel AI SDK DevTools is the lightest-touch option to drop into an existing AI SDK app, with a clear focus on the model-call layer. Think of it as a focused viewer rather than a full development environment.
- Mastra Studio is the most ambitious, closer to a full IDE-meets-console for agentic systems, with first-class evaluation, datasets and a deployable team UI. It’s at its best when your app is structured around Mastra’s primitives.
Pick the one that matches the shape of your project, but please pick something. Building Gen AI without a local debugging tool in 2026 is engineering with the lights off.
Further reading: